Descriptive statistics, computed live
Statistics Dashboard
React/Next.js dashboard for computing descriptive statistics with smooth UI.
Documentation
Statistics Dashboard
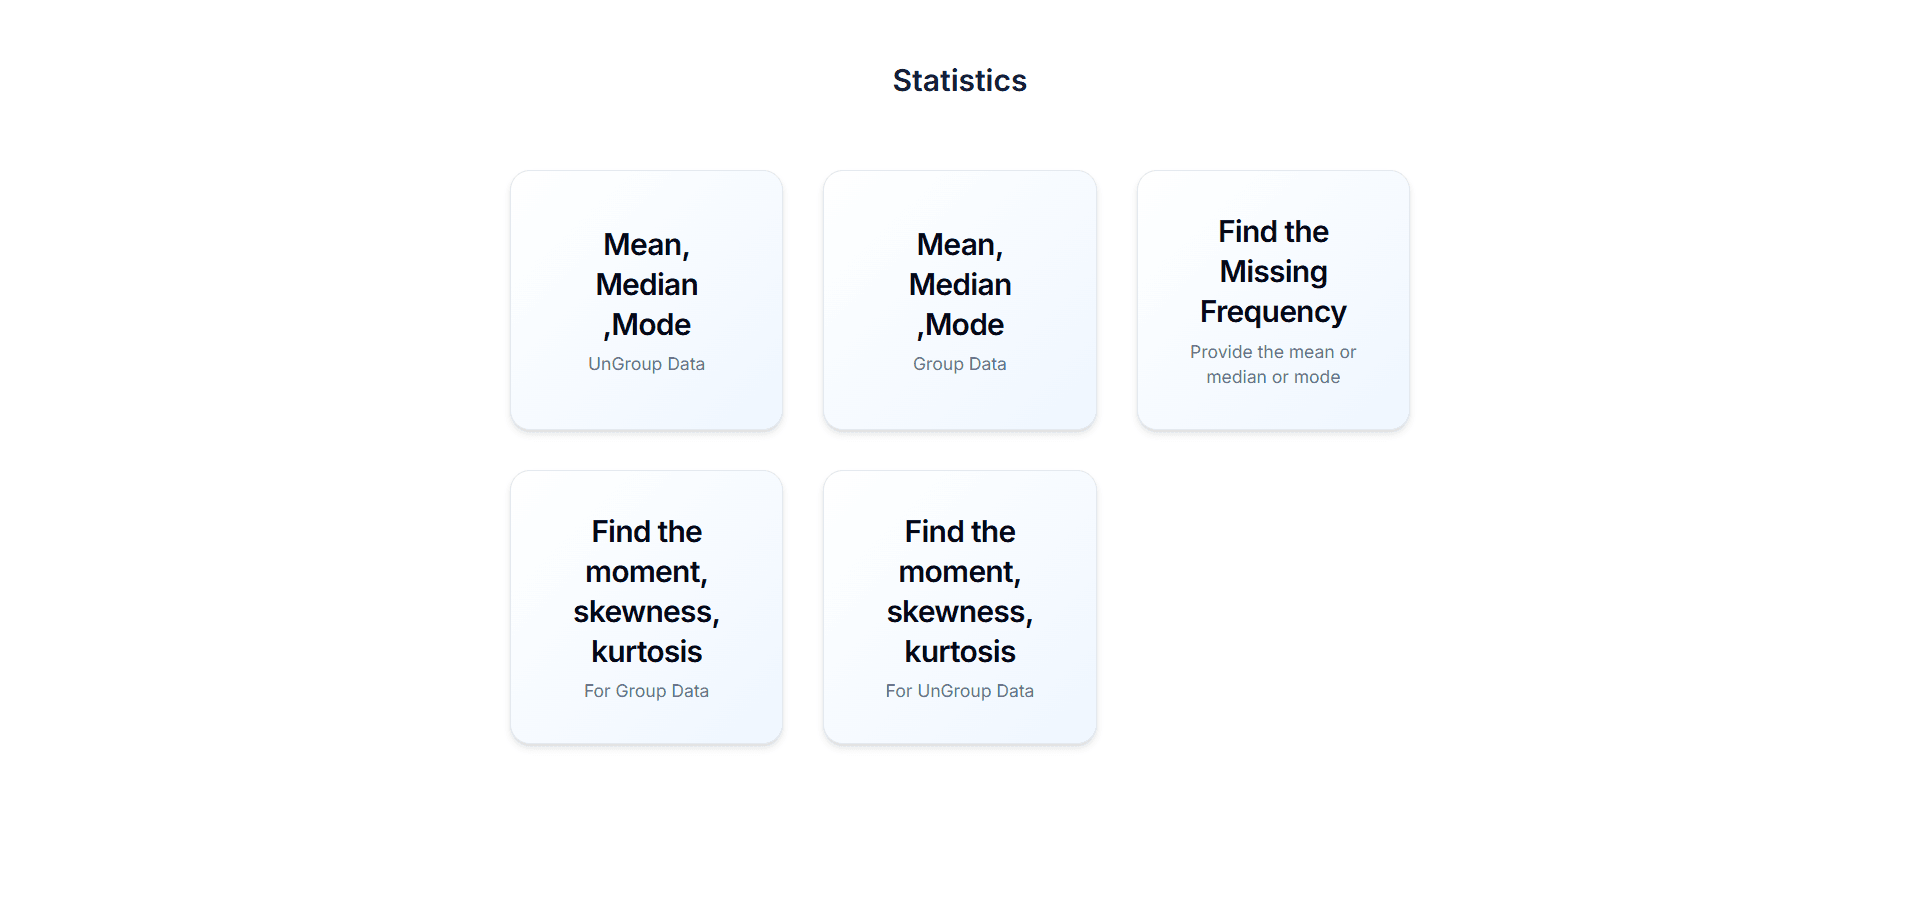
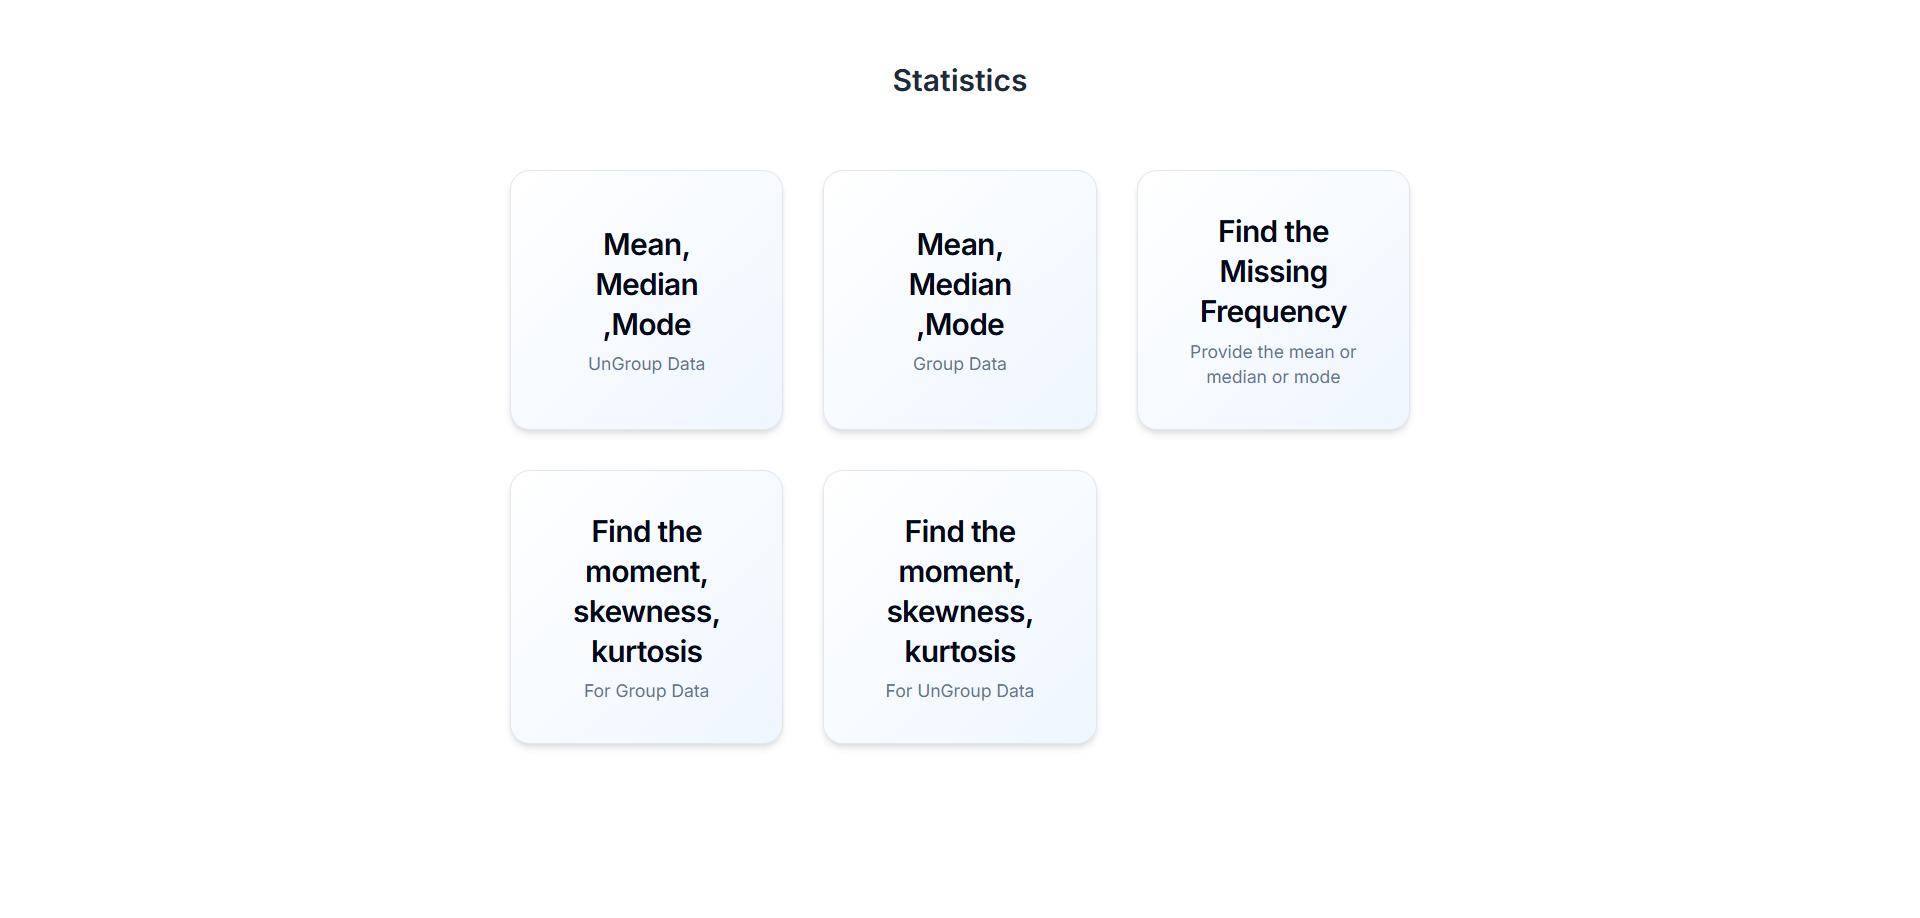
A modern, responsive React/Next.js dashboard for computing descriptive statistics—Mean, Median, Mode, Missing Frequency, Moments, Skewness, and Kurtosis—with an engaging UI powered by Tailwind CSS and NextUI.
Demo
Live Preview: Statistics Dashboard Demo
Features
- Mean, Median, Mode (Ungrouped & Grouped Data)
- Find Missing Frequency given mean (μ), median (˜x), or mode
- Moments, Skewness, Kurtosis (Ungrouped & Grouped Data)
- Responsive Grid layout: 1–3 columns across mobile, tablet, desktop
- Hover Animations & Lift Effects for tactile feedback
- Iconography for quick visual scanning
- Light, Modern Design with subtle gradients and shadows
Tech Stack
- Framework: Next.js 14 / React 18
- Styling: Tailwind CSS
- Components: NextUI
- Icons: react-icons (Feather)
- Deployment: Vercel (recommended)
Getting Started
Prerequisites
- Node.js v16 or higher
- npm, yarn, or pnpm package manager
Installation
# Clone the repo
git clone https://github.com/Hitesh-s0lanki/mean-median-mode
cd statistics-dashboard

# Install dependencies
npm install
# or
# yarn install
# or
# pnpm install
Development
# Start the development server
npm run dev
# or
# yarn dev
# or
# pnpm dev
Open your browser to http://localhost:3000 to see the dashboard.
Production Build
# Build for production
npm run build
npm start
# or
# yarn build && yarn start
Usage
- Navigate to the Statistics page.
- Choose the statistic card you want (Mean/Median/Mode, Missing Frequency, Moments, etc.).
- Input your dataset (ungrouped raw values or grouped frequency table).
- View instant results and formulas.
Enjoy building with data? ⭐️ If you find this project helpful, please give it a star on GitHub!
Keep exploring
Related work
Rumiva
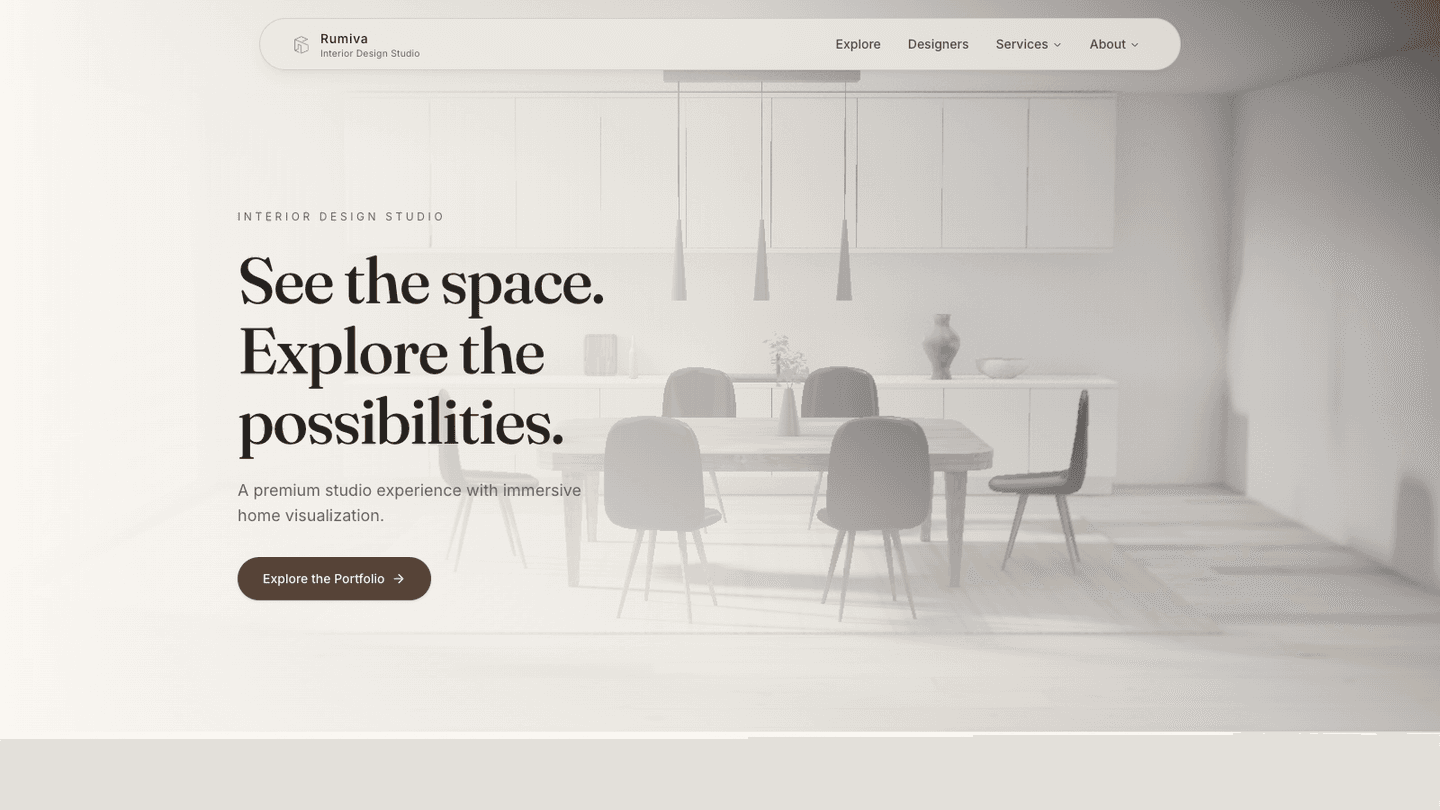
Interior design studio experience built for a 3D web hackathon — a React Three Fiber room you explore straight from the hero, plus designer portfolios, project galleries, and service pages tied together with GSAP motion and smooth scrolling.
SprintPlanner
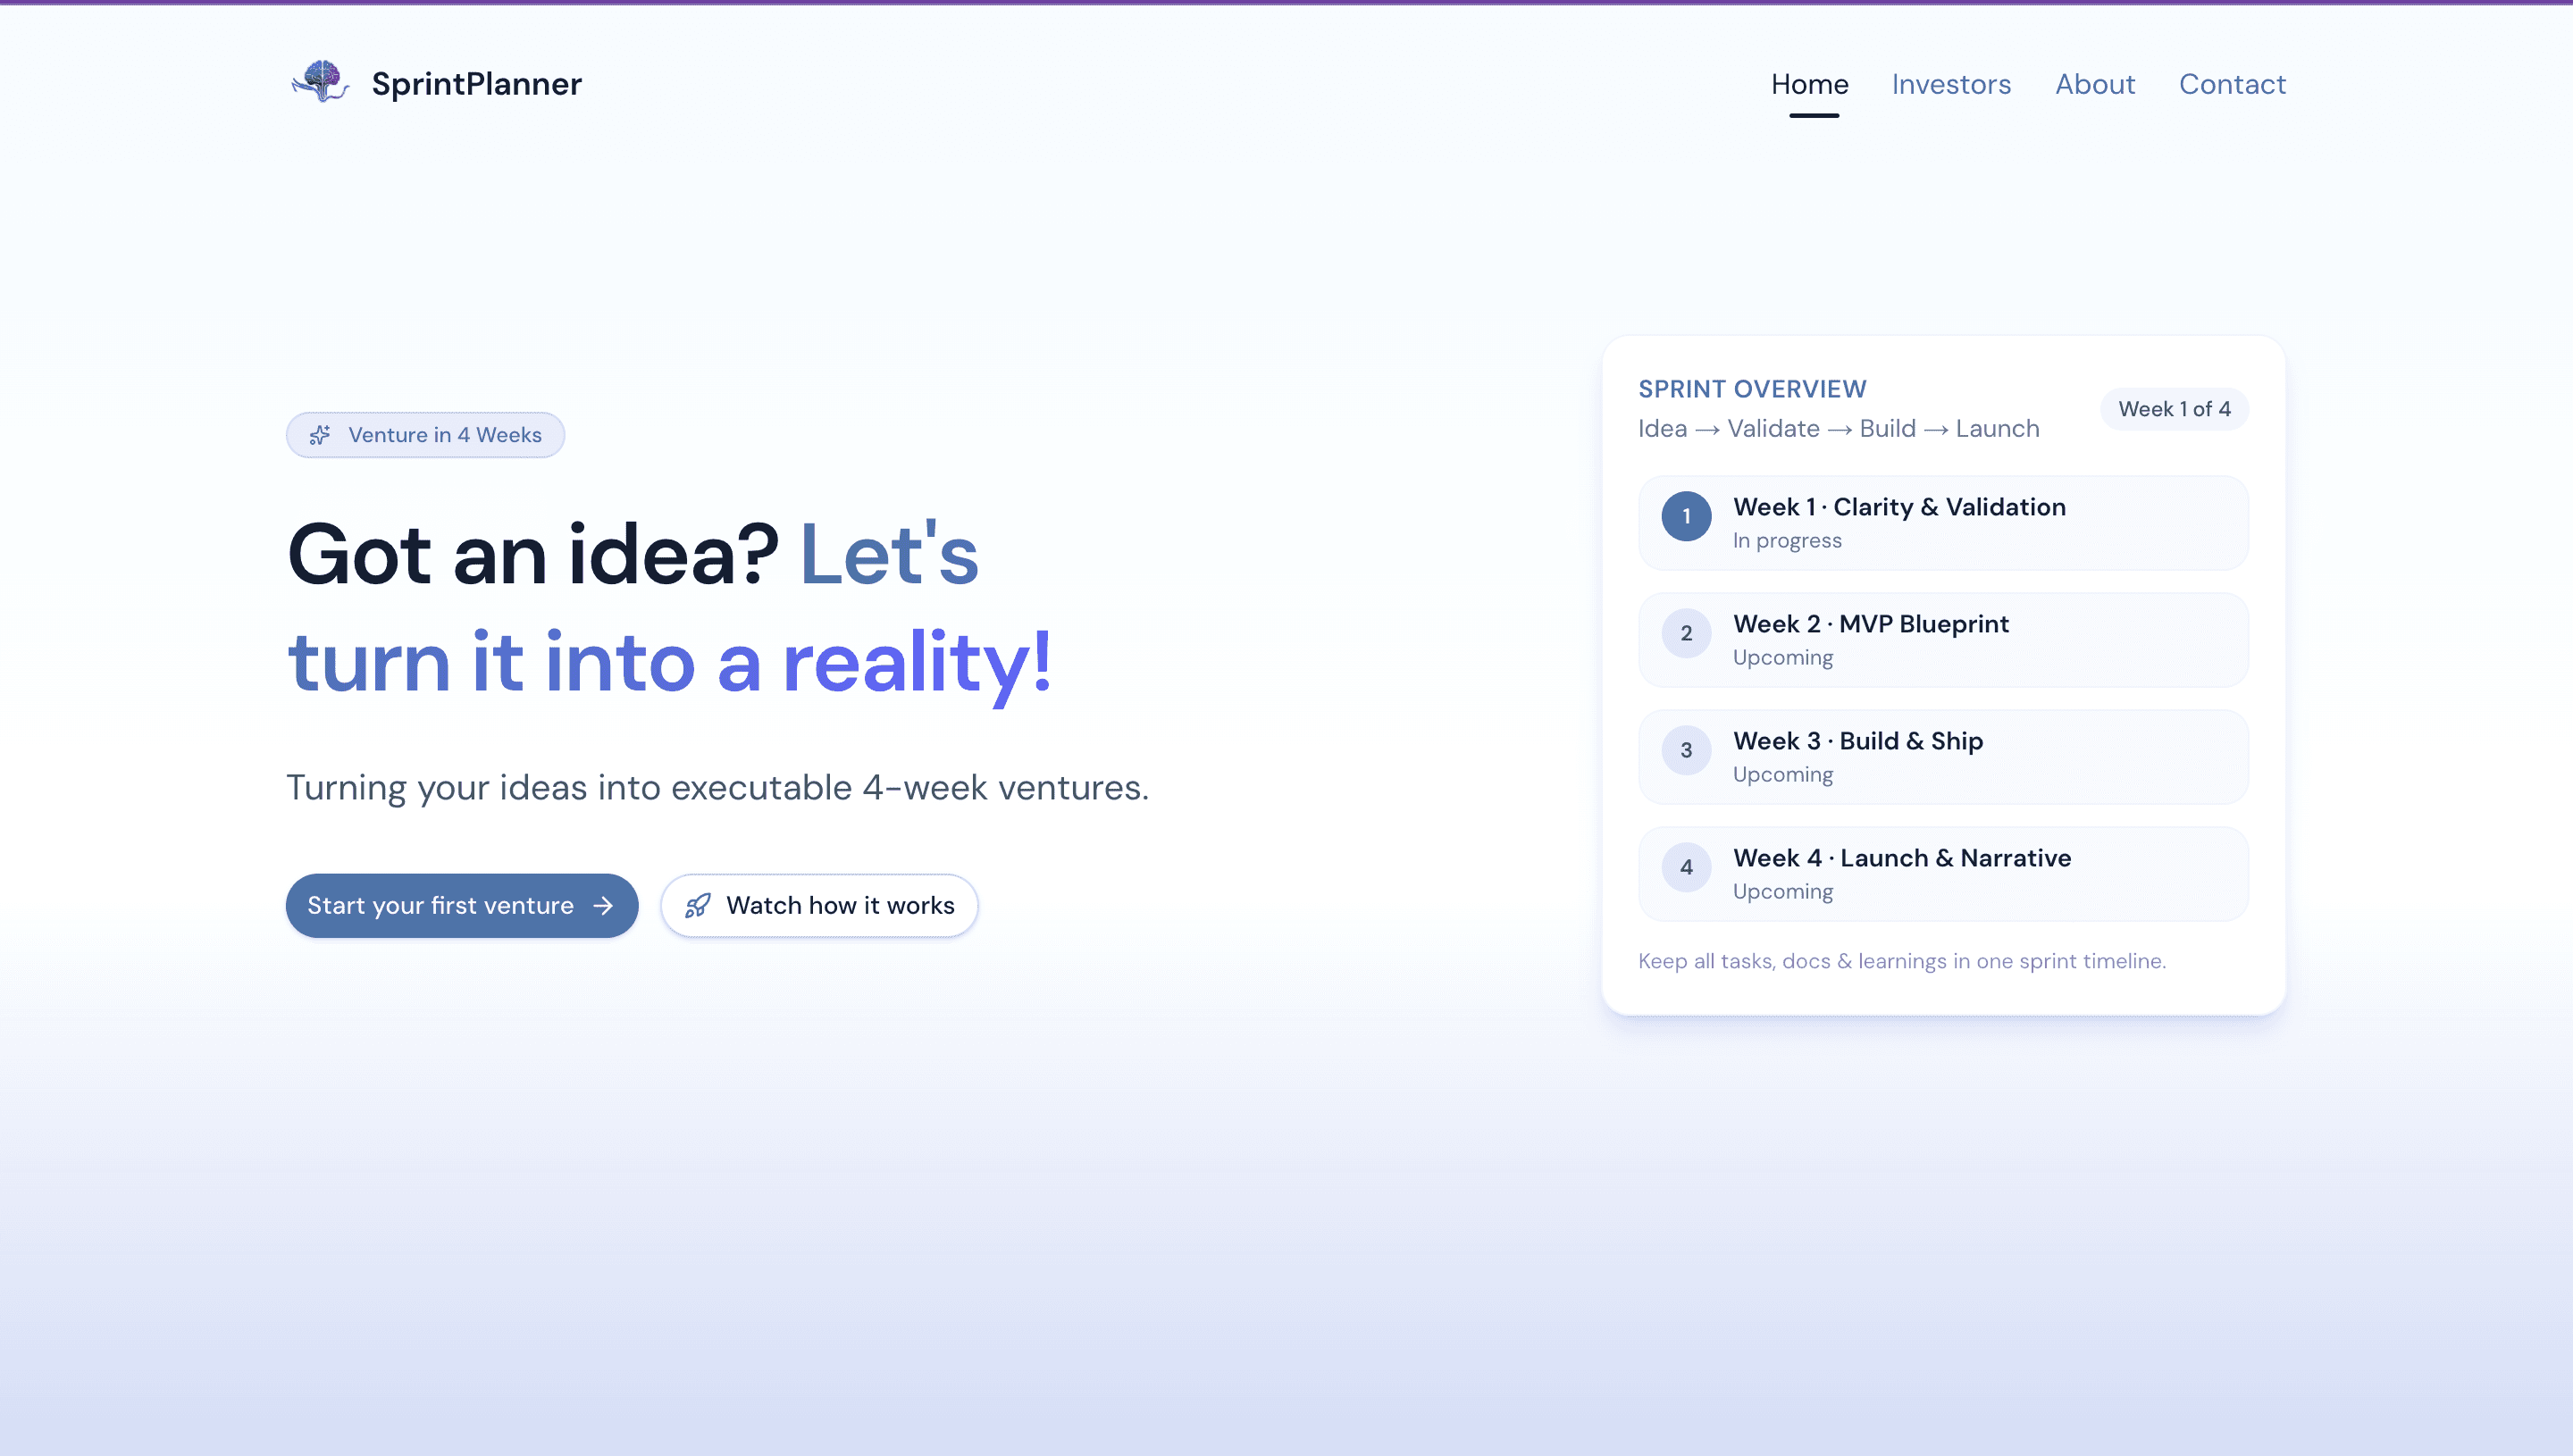
Turning your ideas into executable 4-week ventures.
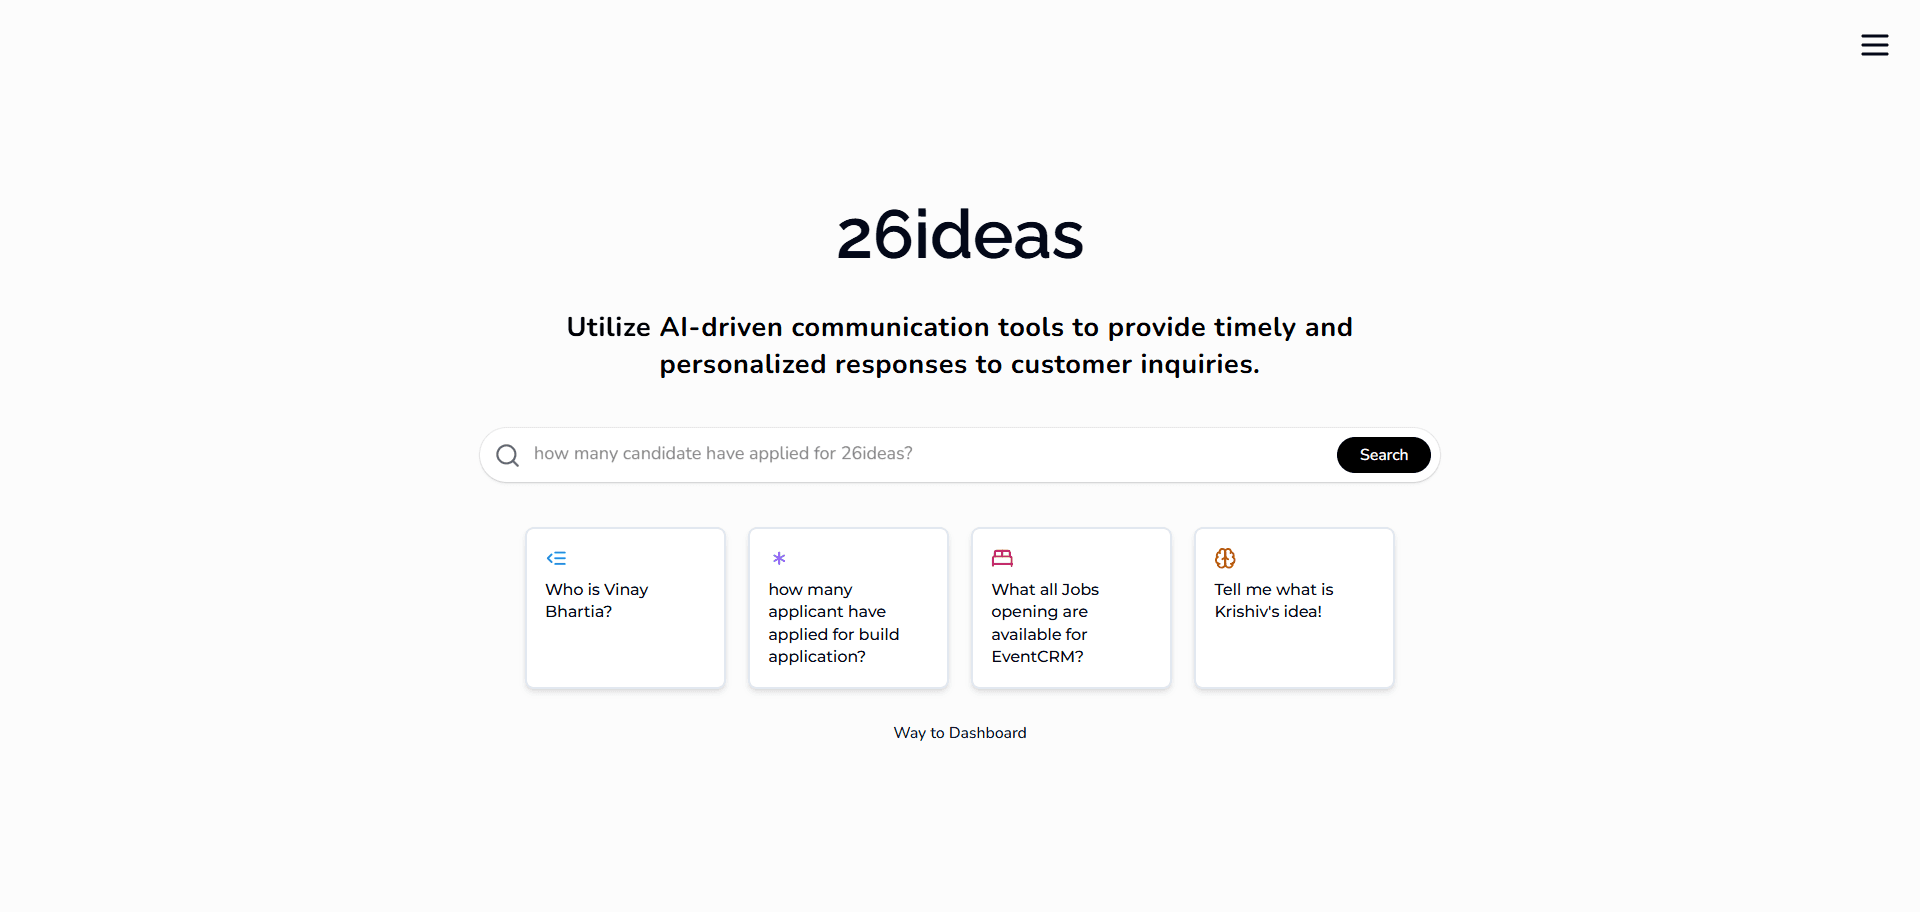
AI-CRM Platform - 26ideas
An AI-powered CRM platform designed to streamline operations by centralizing contacts, jobs, candidates, companies, and ideas.